
Automotive benchmarking means comparing vehicles or components in a systematic way to measure performance, cost, and quality against competitors. Engineers often use vehicle teardown and data analysis to support strategic goals, such as improving design or reducing costs. Manufacturers rely on daily metrics like sales volume, service efficiency, and customer satisfaction to track progress. They also use statistical tools, such as t-tests, to verify improvements and guide decisions. These steps help answer what is benchmarking in automotive industry and show its value for both manufacturers and consumers.
Automotive benchmarking compares vehicles and processes to improve quality, cost, and performance.
Companies use data, teardown analysis, and statistics to find ways to innovate and stay competitive.
Benchmarking covers products, manufacturing, customer experience, and environmental impact.
It helps manufacturers boost efficiency, reduce defects, and plan for future technologies like electric cars.
Consumers benefit from safer, better-quality vehicles and higher satisfaction through benchmarking efforts.
Automotive benchmarking is a systematic process that compares vehicles, components, or practices against competitors or industry leaders. This process helps manufacturers measure performance, cost, and quality. It answers the question, what is benchmarking in automotive industry, by focusing on how companies use data to improve their products and processes. Benchmarking involves setting clear objectives, collecting accurate data, and analyzing performance gaps. Companies use this information to identify best practices and drive innovation.
Note: Benchmarking is not just about copying others. It helps companies find new ways to improve and stay ahead in a fast-changing market.
A bibliometric study describes benchmarking as a cycle that improves product quality, processes, and organizational relationships. Management teams play a direct role in this process. Academic research links benchmarking to business excellence frameworks like Malcolm Baldrige and ISO 9000, showing its importance in both theory and practice.
A recent survey of Indian automotive companies shows different levels of awareness about benchmarking:
|
Awareness Level Category |
Percentage of Indian Automotive Companies |
|---|---|
|
Very Good |
17% |
|
Moderate |
55% |
|
Low |
22% |
|
Very Little Knowledge |
6% |
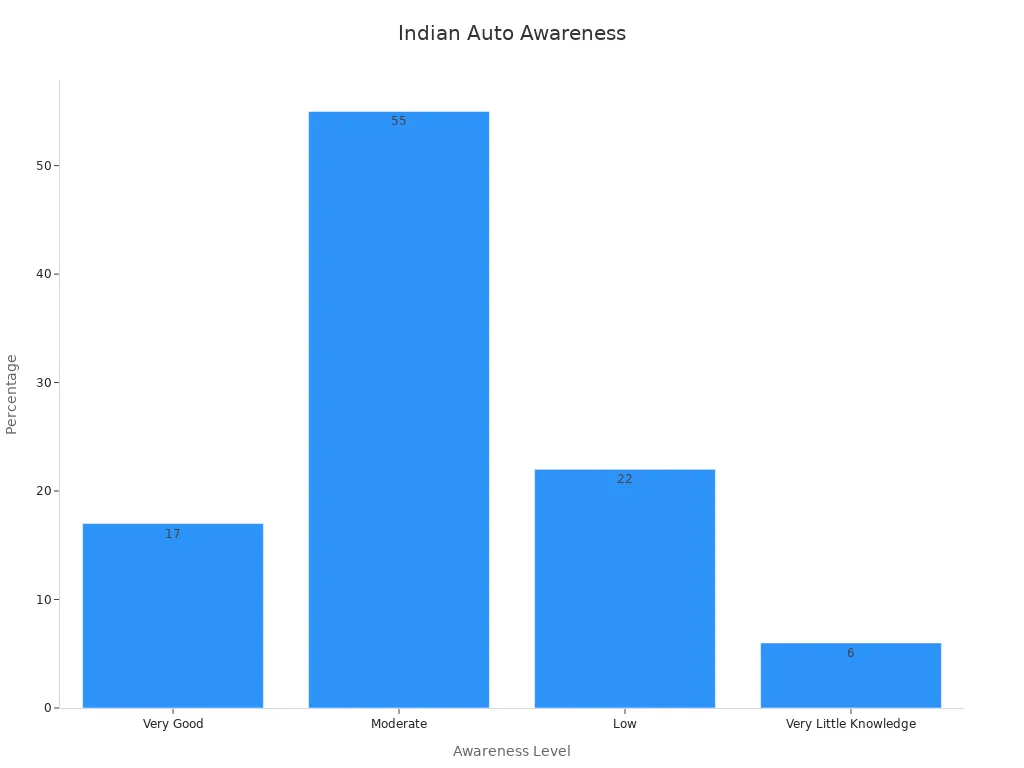
Most companies use benchmarking to compare products, quality, and operations. Barriers include lack of resources, financial limits, and not enough internal expertise. Despite these challenges, benchmarking leads to increased customer satisfaction, better productivity, higher quality, and continuous improvement.
The scope of what is benchmarking in automotive industry covers many areas. Companies benchmark products, manufacturing processes, customer experiences, and environmental performance. They use benchmarking to understand market trends, set goals, and adapt to new technologies like electric and autonomous vehicles.
Here are some key areas included in the scope:
Product teardown and analysis
Performance benchmarking (speed, safety, efficiency)
Manufacturing process benchmarking (assembly line efficiency, downtime costs)
Customer experience benchmarking (satisfaction, service quality)
Environmental benchmarking (emissions, sustainability)
Automotive benchmarking uses data-driven strategies to fuel innovation and improvement. For example, engineers use statistical T-tests to compare design parameters and material properties. These tests help them decide if changes lead to real improvements in safety or performance. Simulation tools also benchmark electric vehicles by measuring driving dynamics, comfort, and powertrain efficiency before building prototypes.
Manufacturers focus on specific areas such as chassis design, battery efficiency, thermal management, and advanced electronics. They use benchmarking data to make decisions across engineering, procurement, and marketing teams. This approach helps them stay competitive as the industry shifts toward connected, data-driven cars.
A table below shows how companies use numerical benchmarks to compare key performance indicators:
|
KPI Metric |
Numerical Benchmark Example |
Explanation |
|---|---|---|
|
Downtime Costs |
Up to $50,000 per minute |
Cost impact of production downtime, used to compare operational efficiency. |
|
Utilization Rate |
About 85% optimal |
Percentage of productive use of equipment or labor, indicating efficiency. |
|
Safety Incidents |
6.3 nonfatal injuries per 100 full-time workers |
Safety performance metric to benchmark workplace safety. |
|
Throughput |
60 cars produced per hour |
Measures production effectiveness by units produced over time. |
|
Inventory Turns |
10 times per year |
Number of times inventory is sold and replaced annually, indicating inventory management efficiency. |
|
EBITDA |
N/A (varies by company) |
Earnings Before Interest, Taxes, Depreciation, and Amortization; used for profitability comparison excluding non-operating factors. |
The scope of what is benchmarking in automotive industry continues to grow. Companies now use benchmarking to support continuous improvement, adapt to new trends, and meet higher standards for safety, performance, and sustainability.
Product benchmarking focuses on comparing the features, quality, and performance of vehicles or components. Automotive companies often analyze competitor vehicles by taking them apart and studying each part. They look at materials, design choices, and technology. This helps engineers find ways to improve their own products. For example, a company might compare the braking systems of two cars to see which one stops faster or lasts longer. Product benchmarking also helps companies spot trends, such as new safety features or advanced infotainment systems. By learning from others, they can create better vehicles for customers.
Process benchmarking examines how companies build cars, manage factories, or deliver services. The goal is to find the best ways to make things faster, safer, and cheaper. Many automotive companies use a structured five-step model to guide their benchmarking activities. This model includes setting goals, collecting data, analyzing gaps, making improvements, and reviewing results.
Indian automotive companies have accepted benchmarking as a tool for improving performance and productivity. They mostly use it to compare product and process attributes. However, they face barriers like lack of resources, financial limits, and not enough internal expertise. Case studies show that a five-step benchmarking model helps guide these activities. Surveys and case studies together show that process benchmarking is practical and useful, especially in places like India.
Companies identify best practices for products, services, or processes.
Many companies customize benchmarking methods to fit their needs.
Case studies show the benefits of process benchmarking in manufacturing.
An in-depth case study found that barriers to internal benchmarking include people, culture, planning, leadership, and access to data. These challenges can slow down progress but do not stop companies from trying to improve.
Competitive benchmarking compares a company’s vehicles or processes with those of leading competitors. This type helps companies understand where they stand in the market. They look at key features, prices, and customer ratings. By comparing these factors, companies can find ways to stand out.
|
Feature |
Leading Brand Benchmark |
Competitor Benchmark |
Impact on Market Positioning |
|---|---|---|---|
|
Safety Rating |
5 stars |
4 to 5 stars |
Higher safety rating helps differentiate and strengthen market position |
|
Fuel Efficiency |
30 MPG |
28 MPG |
Better fuel efficiency influences consumer choice and competitive advantage |
Competitive benchmarking gives companies a clear picture of what customers want. It helps them set goals and make decisions that improve their place in the market.
Automotive benchmarking begins with setting clear objectives that guide the entire process. Companies define measurable goals to focus their efforts and ensure meaningful outcomes. Common objectives include improving manufacturing efficiency, reducing waste, enhancing quality control, and increasing profitability. For example, manufacturers often aim to optimize production processes or adopt lean practices to address cost inefficiencies.
To achieve these objectives, teams establish relevant metrics and benchmarks. They use statistical tools like p-values and confidence intervals to ensure the reliability of results. Randomized sampling and proper test durations help maintain data validity. Continuous monitoring and reassessment ensure sustained improvements over time. These steps create a structured framework that drives innovation and operational excellence.
Teardown analysis plays a critical role in automotive benchmarking. Engineers dismantle vehicles to evaluate components and uncover design insights. This method reveals material choices, manufacturing techniques, and performance characteristics. For instance, advanced digital tools analyze teardown data to optimize designs and reduce costs. Platforms like Iceberg 3.0 provide scalable competitive assessments, while Digital Twins technology accelerates research and development.
A validated teardown method for lead batteries combines electrical testing with physical verification. Engineers measure internal resistance and voltage to assess battery aging and failure modes. Physical teardown confirms these findings, ensuring statistical reliability. This approach eliminates subjectivity and enhances component evaluation. By mapping innovation trends and identifying supply chain vulnerabilities, teardown analysis transforms raw data into actionable strategies.
Data collection and comparison are essential for effective benchmarking. Companies gather performance data from internal records, industry reports, and competitor publications. They analyze this data to identify gaps and develop improvement strategies. For example, dealerships use model-based clustering to segment stores based on location and competition. Tailored recommendations improve profitability and sales effectiveness.
Benchmarking relies on both quantitative and qualitative data. Numerical statistics measure efficiency, while surveys and interviews capture operational nuances. Data visualization tools help communicate findings clearly. Continuous benchmarking cycles compare performance, identify gaps, and implement strategies for improvement. By adapting to specific contexts and maintaining data accuracy, companies ensure benchmarking success.

Automotive benchmarking drives innovation by helping companies find new ways to improve vehicles. Engineers use large datasets to compare many cars and spot trends. For example, mass benchmarking of 280 steel sedans gives a clear picture of how body structure mass changes with vehicle size and weight. This data helps teams set targets for lighter, more efficient designs. The FutureSteelVehicle project shows how using advanced high-strength steels and smart design can make cars much lighter than expected. Companies use regression models to predict what a car should weigh. When a vehicle is lighter than the model predicts, it often means engineers used new materials or creative solutions. Benchmarking highlights these outliers and encourages others to follow.
|
Statistical Evidence |
Description |
Innovation Support |
|---|---|---|
|
Mass benchmarking |
Compares body structure mass across many vehicles |
Sets targets for lightweight design |
|
Regression analysis |
Links mass to size and load |
Predicts expected mass, finds efficient designs |
|
FSV project |
Uses advanced materials |
Achieves lighter structures than typical benchmarks |
Benchmarking also improves quality. Companies study how competitors meet customer needs and set high standards for their own products. Recent studies on premium vehicle interiors show that customers expect both style and sustainability. Benchmarking helps companies find ways to use lightweight materials and reduce CO2 emissions. However, they must also meet strict standards for comfort and appearance. By comparing products and processes, manufacturers can balance quality, cost, and sustainability. This process supports better decision-making and helps companies keep up with changing rules and customer demands.
Note: Benchmarking supports the shift toward greener vehicles, but companies must balance new materials with customer expectations for quality.
Automotive benchmarking faces several challenges. Benchmarks often lack context and may not fit every company’s unique situation. Differences in company size, business models, and market conditions make direct comparisons difficult. Data can vary between sources, and definitions of key terms may not match. Small or niche companies may find industry benchmarks less useful. Legal rules and reluctance to share data also limit cross-company comparisons. The global nature of the industry adds complexity, as regional and seasonal factors affect results. Companies need to customize benchmarks and use multiple sources to get the best results. Cooperation and standardization can help, but these remain ongoing challenges.
Benchmarks may not reflect unique strategies or local conditions.
Data differences and lack of standards make comparisons hard.
Legal and business barriers limit data sharing.
One-size-fits-all benchmarks rarely work for every company.
Industry needs more cooperation and common platforms for better benchmarking.
Automotive benchmarking gives manufacturers a clear view of their strengths and weaknesses. Companies use benchmarking to spot gaps in performance, set goals, and track progress. Research shows that regular benchmarking leads to real improvements:
Companies report a 20-25% boost in efficiency after using benchmarking.
A manufacturer in Geneva, IL reduced setup times by 35%, gaining 20 extra productive hours each week.
Changeover times dropped by 50% for a manufacturer in Plainfield.
Defects fell by 45% at a plant in Aurora after focusing on key process steps.
Overall Equipment Effectiveness (OEE) improved by 15% within three months in St. Charles, IL.
Material costs dropped by 10-20% in the automotive industry after adopting zonal-based E/E vehicle architecture.
|
Improvement Area |
Data / Result |
Description / Impact |
|---|---|---|
|
Efficiency Boost |
20-25% |
Average increase with regular benchmarking |
|
Setup Time Reduction |
35% |
20 extra productive hours per week |
|
Changeover Time Reduction |
50% |
Changeover times cut in half |
|
Defect Reduction |
45% |
Fewer defects after process focus |
|
OEE Improvement |
15% |
Better equipment use in three months |
|
Material Cost Reduction |
10-20% |
Lower costs with new vehicle architecture |
Benchmarking also helps companies plan for the future. In 2020, only 7% of vehicle sales among 30 major companies were low-carbon models. Some leaders like Tesla and Daimler made progress, but most companies still rely on traditional engines. Benchmarking highlights these gaps and pushes companies to set better goals for emissions and innovation.
Consumers benefit from benchmarking through better quality, safety, and satisfaction. Companies use benchmarking data to improve vehicles and services. Customer satisfaction scores show these results:
|
Metric / Segment |
Score / Change |
Notes |
|---|---|---|
|
Overall Driver Satisfaction |
80 / +1% |
Industry score out of 100 as inventory normalizes |
|
Mass-market Segment |
79 / unchanged |
Subaru, Toyota, Honda, Mazda, Buick, Kia, Ford, Volkswagen, Ram |
|
Luxury Segment |
81 / unchanged |
Mercedes-Benz, Tesla, Lexus, Cadillac, Audi, BMW, Lincoln, Acura |
|
Subaru |
83 / +1% |
Tied for first in mass-market; known for safety and dependability |
|
Toyota |
83 / -1% |
Tied for first in mass-market; focus on quality and hybrids |
|
Honda |
82 / +1% |
Third place in mass-market segment |
|
Driving Performance & Safety |
84 / same |
High scores for key vehicle attributes |
|
Gas Mileage |
80 / +3% |
Improved fuel efficiency |
|
Technology |
80 / +3% |
Advances in vehicle tech |
|
Mercedes-Benz (Luxury) |
83 / +4% |
Leading luxury brand, high satisfaction for hybrids |
|
Tesla (Luxury) |
83 / unchanged |
Competes for luxury lead; pricing and complaint handling affect satisfaction |
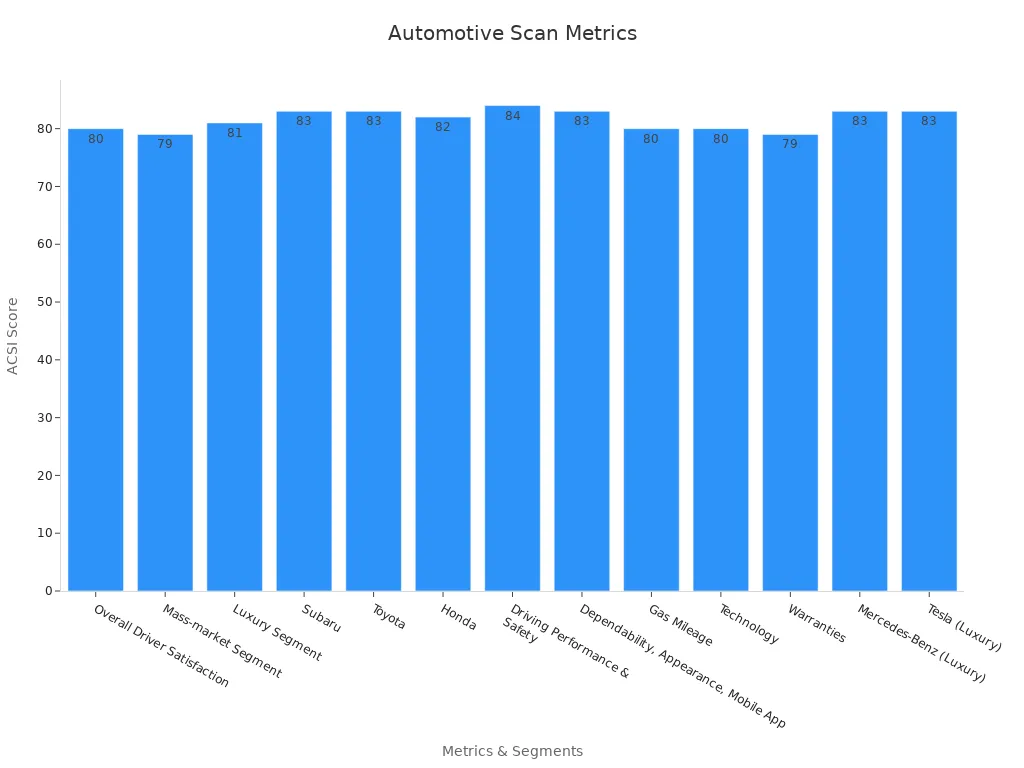
A Customer Satisfaction Index (CSI) score above 90 signals high satisfaction. Automakers and dealerships use these scores to find strengths and fix problems. Benchmarking helps companies deliver safer, more reliable, and more enjoyable vehicles for everyone.
Automotive benchmarking gives companies a way to measure progress and improve products. Studies using data from 131 companies over six years show that benchmarking can affect financial trends, but results may change from year to year. Rich datasets on automated vehicles help track real-world changes in safety and performance. Today, what is benchmarking in automotive industry means using advanced analytics, AI, and big data to find new ways to design safer, greener cars.
Future benchmarking will use IoT sensors, machine learning, and real-time data to drive innovation.
New rules and investments in electric vehicles will shape what companies measure next.
Automotive benchmarking helps companies find ways to improve their vehicles and processes. They compare their products to others in the market. This process leads to better quality, lower costs, and new ideas.
Engineers take apart a vehicle piece by piece. They study each part to learn about materials, design, and technology. This method helps them understand how competitors build their cars.
Car companies use benchmarking data to set goals, track progress, and make better decisions. They want to stay ahead in the market and meet customer needs.
Yes. Benchmarking lets companies compare safety features and crash test results. They use this information to design safer vehicles and meet strict safety standards.


Mr. Lind
Email:[email protected]
Hongkong office: Atestman Co. Limited
Shenzhen office: Atestman Technology Co., Ltd.
Factory site: High-tech Park, Hefei, Anhui , China